A simple question, really: Does the price of a round directly correlate to the quality of that round? This simple Statistics 201 exercise aims to figure out just how much a high price point equates to high quality of architecture in the eyes of major rating organizations.
Let’s get the asterisks out of the way first: It’s impossible to create a truly scientific measure for something so intangible as the quality of an art form, so we’re going to use the Metacritic method: compiling other people’s reviews to provide a gauge of quality based on some collection of data. We’ll also limit this exercise to public courses, as those businesses are less opaque about their pricing (although courses, as a whole, are heading the wrong direction on this front thanks to “peak pricing” methodology).
The sources for our data come from three publications that run legitimate “Top 100 You Can Play”-type features on a biyearly basis: Golfweek, GOLF magazine, and Golf Digest. Here are the technical details:
 This is a photo from Pacific Dunes, because it’s one of the courses that I’ve played, and because it because it makes the sun look like the monstrous space god that it is.(Photo Cred: BPBM)
- We created the cumulative list of quality rankings by generating an average for each course featured, based on its ranking within each of the publications. If a course was ranked within two of the lists but not the third, we gave it a third score of “101” (or 85 if not included in GOLF) to suggest it would have been ranked next by that publication. If a course was only ranked by one of the publications, we removed it from consideration. This resulted in a list of 87 courses.
- For easier viewing, we assigned a “quality score” by subtracting the course’s mean rank from 100. So, for example, Pebble Beach (the top-ranked course on each list) had a quality score of 99, created by subtracting one from 100.
- Look, we know some of you are going to add comments complaining about how “such-and-such course is ranked way too low” because you refuse to accept the actual purpose of this exercise. These rankings are not objective in any way. They are accumulated from data to analyze a potential cost-to-course architecture ratio, and that’s it, dammit.
- The cost for a round is represented by the peak cost for playing that course. This does not include the costs of a required resort / property stay; although we understand these prices are necessary to access some courses featured on the list, they are both near impossible to hunt down, and ultimately detached from the round itself. That said, we chose to include the cost of a driving cart (if a separate cost from the initial greens fee) because, despite our own preference for walking, we understand that yes, some people really do need to take a cart.
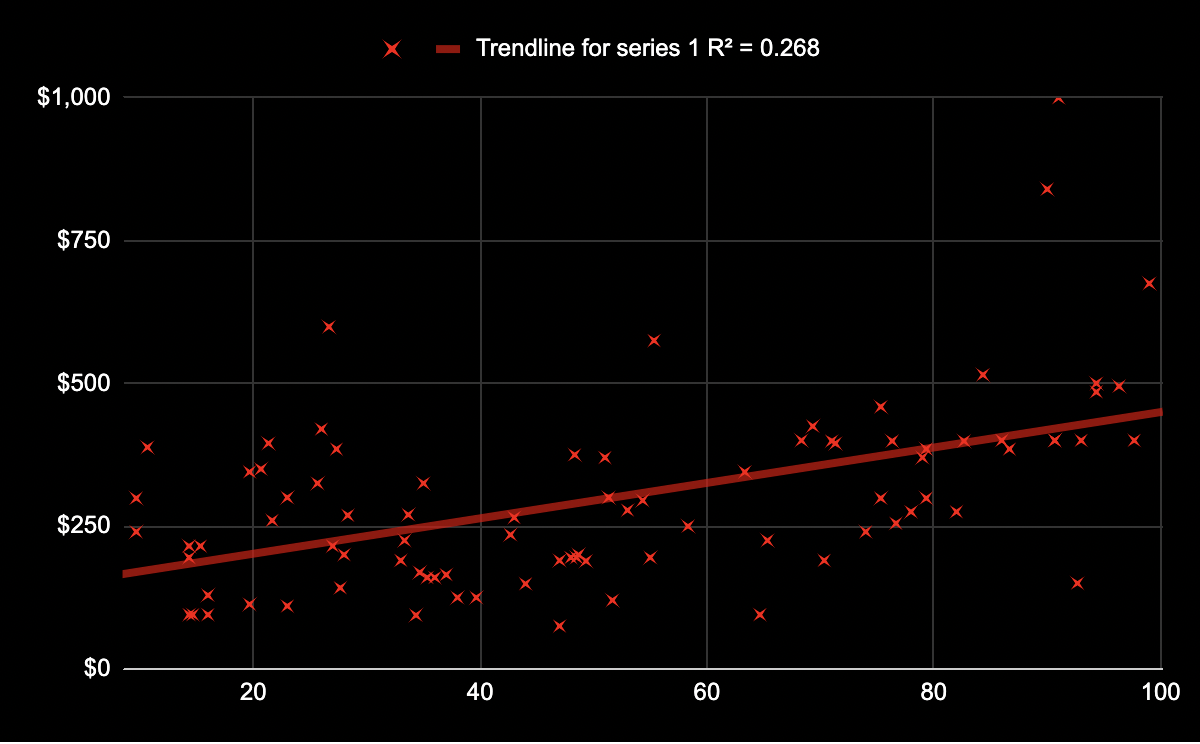
Here’s the resulting chart showing the results of the accumulated data. The number along the X-axis is the “quality score,” with the highest-ranked courses being positioned farther right (Pebble Beach bleeds off the chart at the right). The Y-axis represents the cost of the round, with the highest price being the farthest up (Shadow Creek appears laughably high toward the top).
 … “A-HA!” said the bad statistician. (Photo Cred: BPBM Graphics Team)
As you can see, there is indeed a trendline through the scatter plot that indicates yes, there is some trend indicating that the cost of a round increases compared to its perceived quality.
But (capital “B” here), a major qualifier exists at the top of the chart. The R2 for the data series is used to indicate the reliability of the trendline. An R2 of “1” indicates a perfect correlation, and that correlation becomes less reliable as the R2 decreases. Our R2 is just 0.268, indicating that it’s not very reliable at all. This doesn’t mean that the trend we’ve shown is wrong, but that the data features so many outliers that the trend can’t be trusted as definitive. For example, Cascata was the mean No. 68 course in our cumulative list, while its $599 greens fee made it the third-most expensive on this list (and second in Las Vegas).
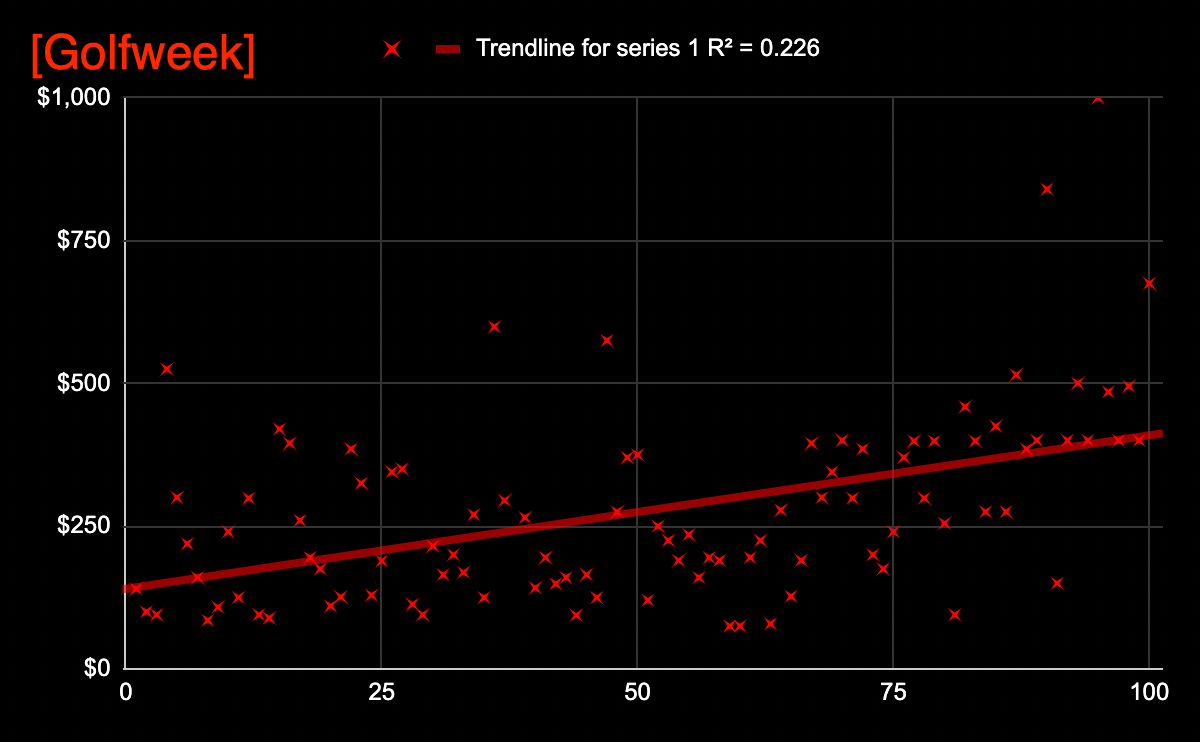
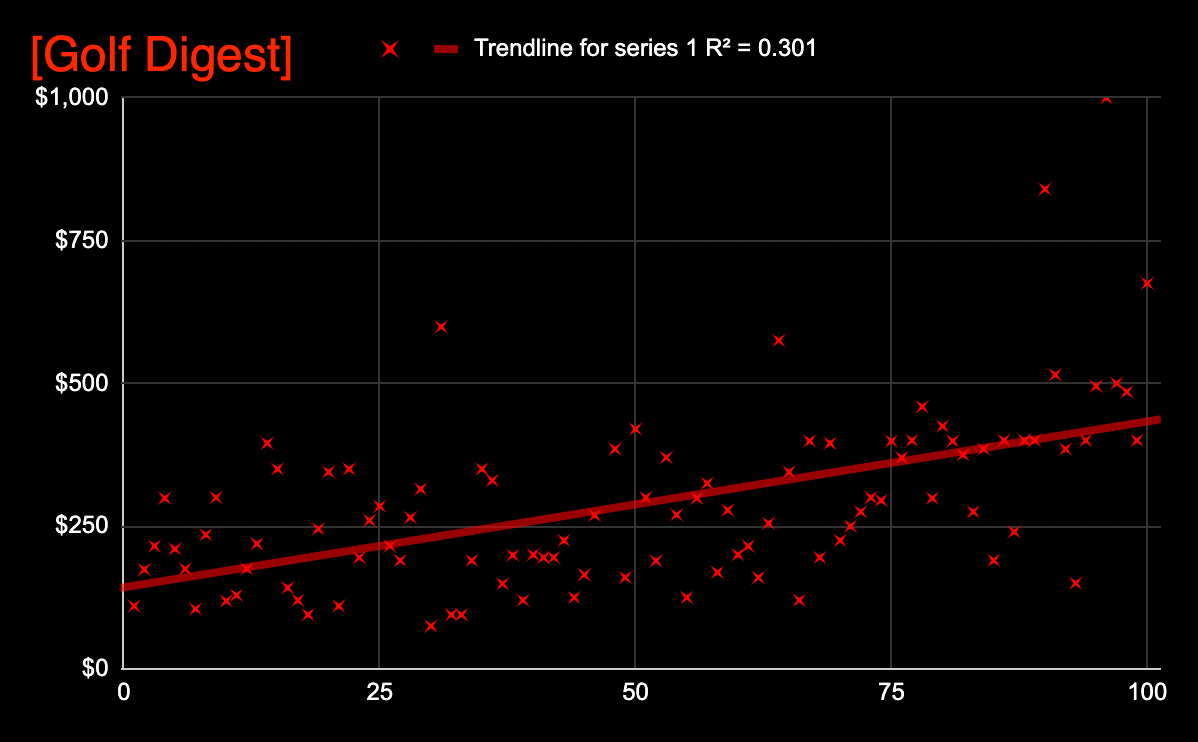
Naturally, we wondered if any of our data sources were a bit more inclined toward price as an indicator of quality, so we ran a similar exercise, measuring the “quality scores” of each ranking agency’s Top 100 (or 84, for GOLF) against the greens fee charged for each. You can see each of their performances below:
 (Photo Cred: BPBM Graphix ’87)
As you can see, “clearly” the correlation between cost-and-quality is strongest with GOLF. Kidding, of course…the .3333 R2 for that rating system does demonstrate the most reliable correlation between the two concepts…but that’s not a very high bar, still rife with outlying data.
Now before you Digest raters start getting excited about the perceived bourgeois outlook over at GOLF, this exercise includes a pretty good anecdote for how irrelevant a trendline is without a strong R2. GOLF may have the “strongest” connection between price and rank…but it also features the lowest mean price within its ranked courses ($272), compared to the highest mean price, which is Digest’s list ($299).
So there you have it. A lot of work to prove little.
It is quite possible, of course, that the river actually flows in the opposite direction: that higher course ratings from these publications push up the greens fees, and not vice versa. In order to gauge that theory, we’d need to go back and gather data on from every similar course ranking that’s occurred for each publication, the going rate at the courses in question at the time of each ranking, and then compare the rises in price at each course both as it correlates to rankings changes and, separately, against the changing rates of inflation during the same timespan, to see whether acclaim or simple economics was impacting price changes.
In other words, it would be a lot of work. Best of luck if you decide to tackle that one!